Crypto On-Ramping Trends in H1 2026: The Mercuryo Report
We looked at six months of Mercuryo on-ramp data to see how people bought crypto in H1 2026: what they purchased, how they paid, and from which devices. Below is what changed compared with H2 2025, and what it means for anyone building around payments or Web3.
In six months, stablecoins went from under half of everything bought on Mercuryo to a clear majority. That was the loudest shift of H1 2026, but not the only one: what people buy, how they pay, and what they pay with all moved, and not always in the direction you'd expect.
This report covers four areas: the domination of stablecoins, how Bitcoin, Ethereum and other tokens behaved alongside it, how payment methods split by purchase size, and how devices shape spending. Each section ends with what the numbers mean for builders.
Put shortly, H1 2026 was the half crypto buying consolidated: the money into stablecoins, the frequency onto phones and mobile wallets, the volume onto cards. The rest of this report is the details behind that sentence.
Some insights that were true a year ago are now becoming outdated and no longer relevant. That’s why we're sharing our findings to help you build products around how people are buying crypto today.
Key findings at a glance
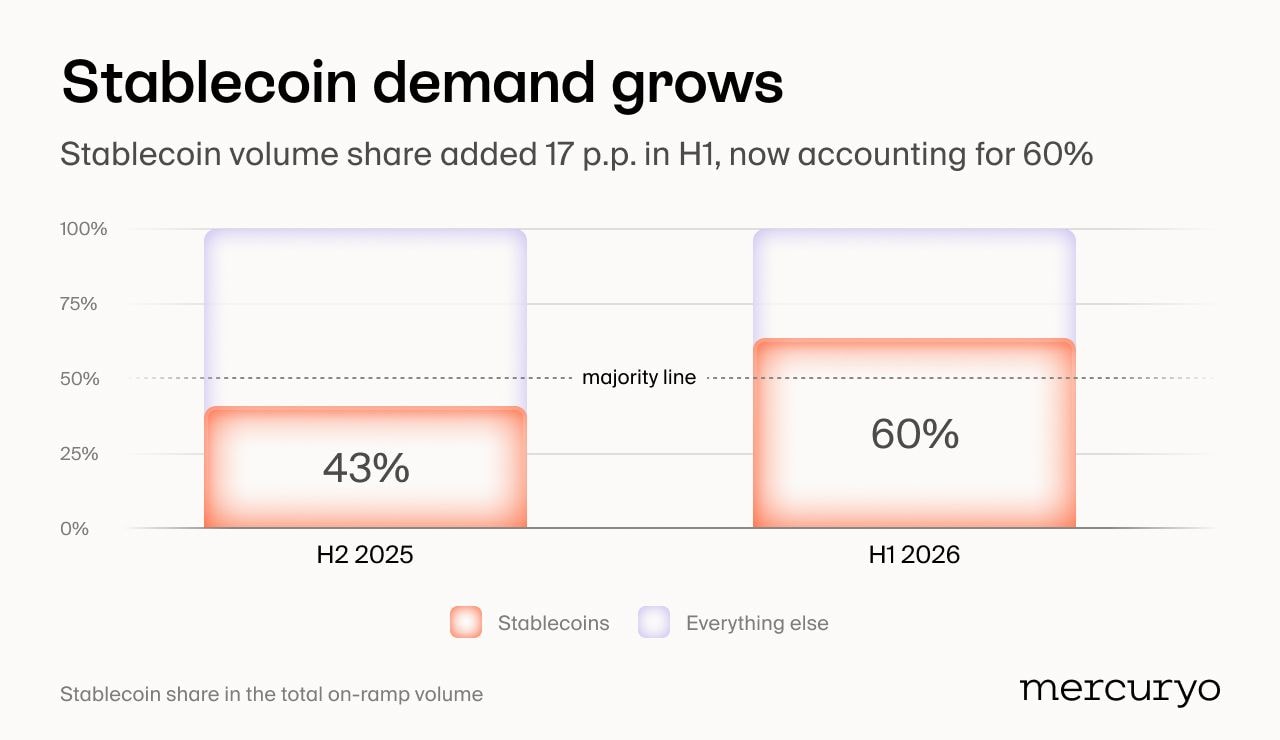
- Stablecoins rose from 43% to 60% of on-ramp volume in six months, crossing the majority line.
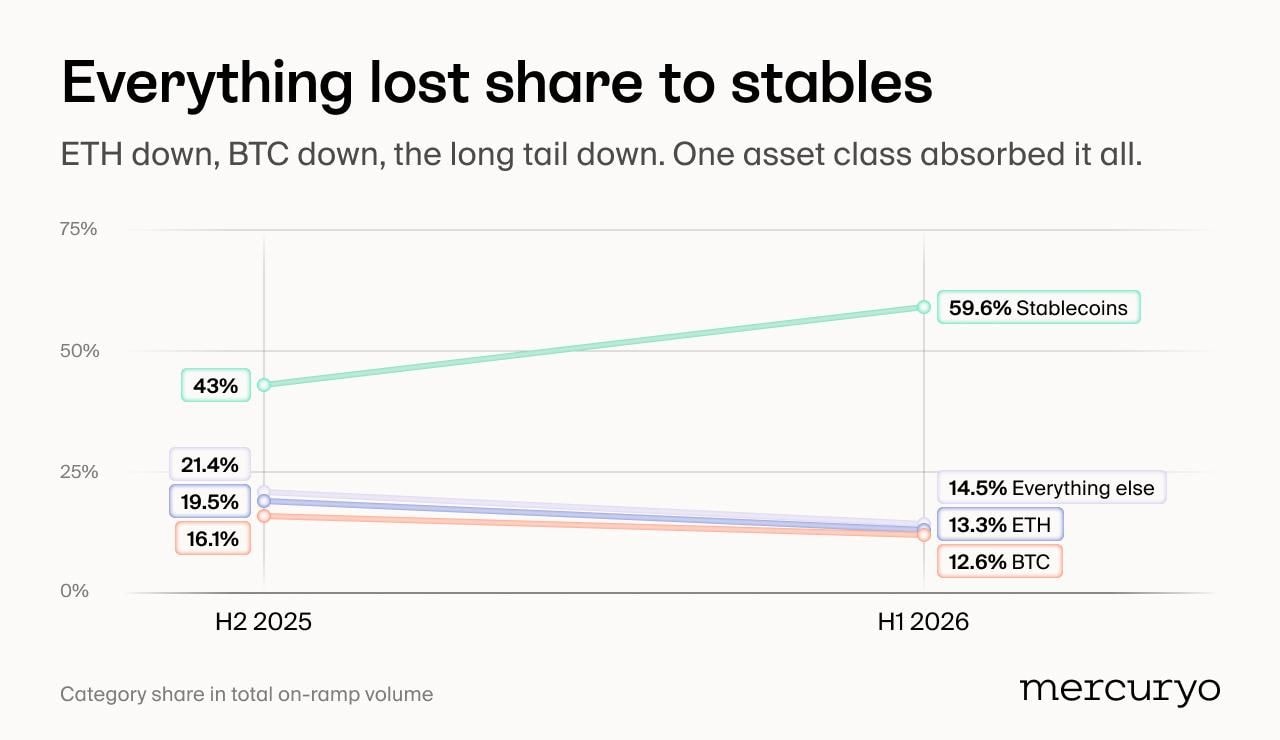
- Every other asset class lost its volume share: Ethereum fell from 19.5% to 13.3%, Bitcoin from 16.1% to 12.6%, and the long tail from 21.4% to 14.5%.
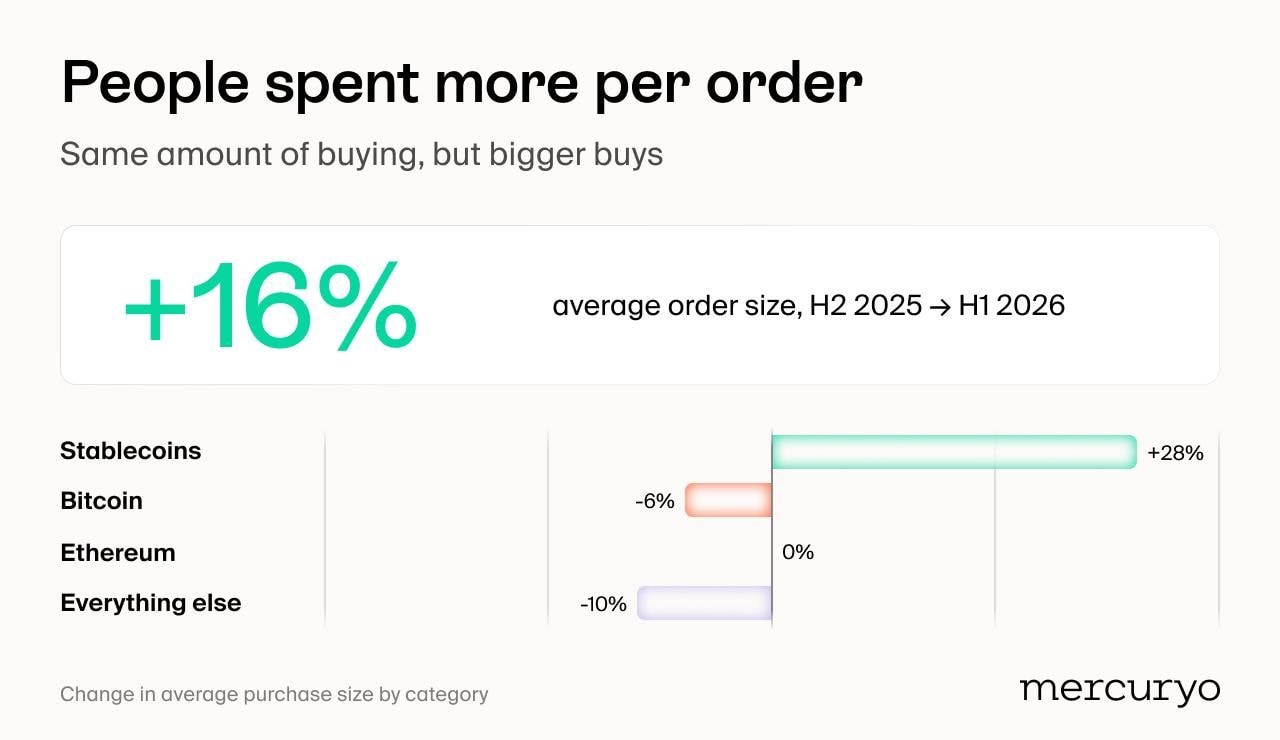
- Average purchase size grew 16%, led by a 28% increase in stablecoin orders.
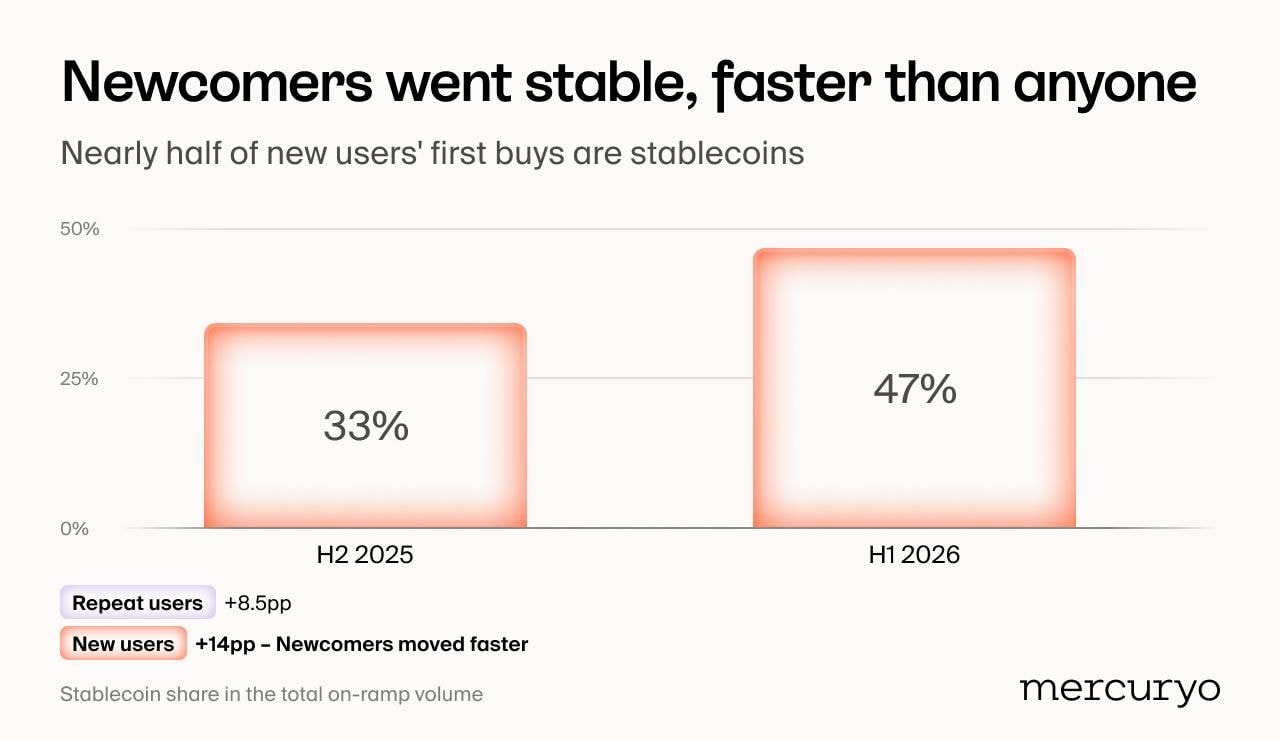
- Stablecoins made up 47% of first purchases in H1 2026, up from 33%, with faster adoption among new users.
- Cards drove 66% of volume from 42% of purchases, while mobile wallets handled half of purchases but a shrinking volume share.
- Nine in ten purchases came from mobile devices, and Android users' average order size grew 29%, almost twice the pace of iOS.
The stablecoin takeover
Nearly $6 of every $10 on-ramped in H1 went into stablecoins.
The backdrop helps explain why. Amid macroeconomic uncertainty, trade tensions, delayed rate-cut expectations, and capital shifting toward equities, the total crypto market cap fell roughly 30% in H1, from $2.96T to $2.08T. As markets turn down, money tends to rotate toward less volatile assets, and H1 2026 was consistent with that pattern.
Our data shows stablecoin share in on-ramp volume jumped from 43% in H2 2025 to 60%. Their share of transactions also rose, from 33% to 41%, while average stablecoin order size grew 28% half-over-half.
Strong growth across all three metrics points the same way: lower risk appetite and a preference for comparatively safer strategies in a volatile market.
As stablecoins absorbed more demand, every other asset lost relative share.
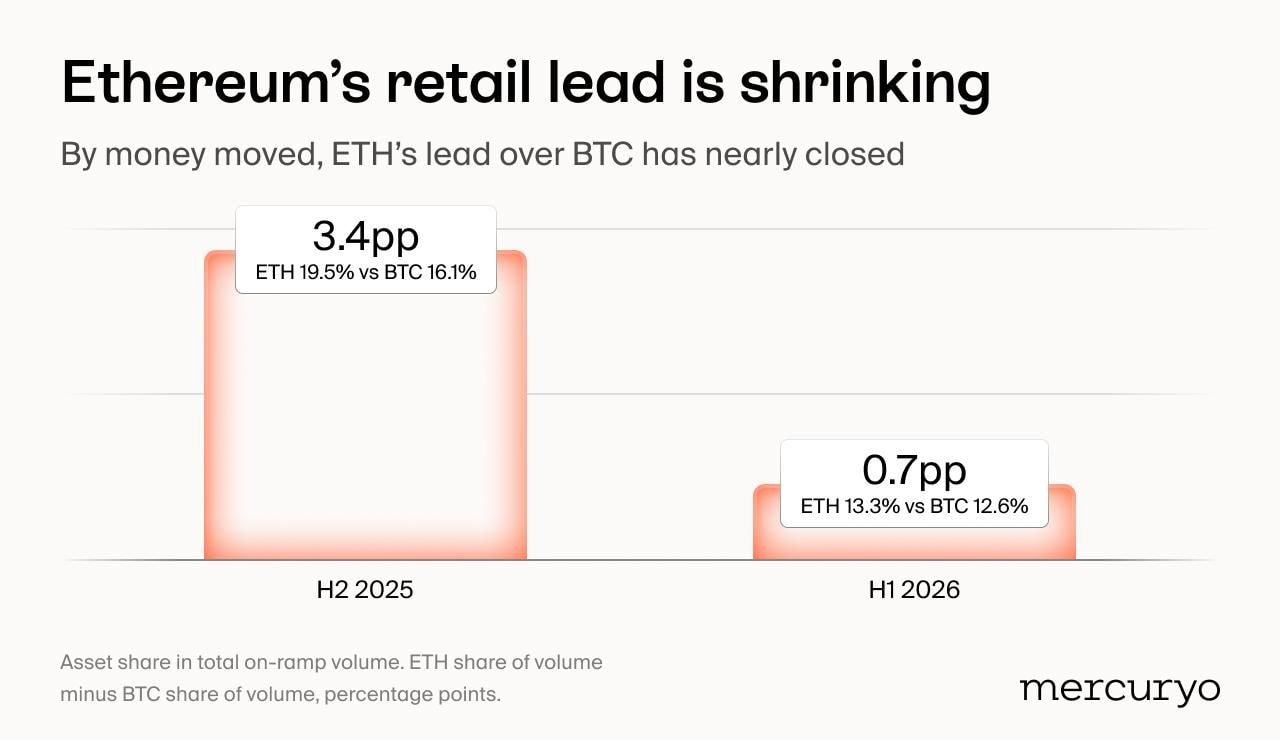
Bitcoin's share of volume dropped 3.5pp, from 16.1% to 12.6%. Ethereum fell harder, down 6.2pp from 19.5% to 13.3%. All other assets combined took the biggest hit, losing 6.9pp, from 21.4% to 14.5%.
Transaction counts add more context. Bitcoin's share of purchases stayed roughly level with H2 2025 (12.5% to 12.2%) even as its volume share fell (16.1% to 12.6%), a sign that part of the dollar-volume decline reflects falling asset prices rather than falling demand.
Ethereum, by contrast, lost ground on both measures: its volume share fell from 19.5% to 13.3% and purchase share from 18.3% to 14.7%. Fewer people were buying ETH, not just buying it cheaper.
Across all assets combined, the average purchase size increased 16%. The growth was concentrated in one place: stablecoin orders grew 28%, while Bitcoin's average order shrank about 6%, Ethereum's barely moved, and everything else dropped 10%.
New user behaviour often says a lot about market sentiment, and here it amplifies the pattern: the stablecoin demand is real.
In H1, 47% of new users bought stablecoins as their first transaction, up 14pp half-over-half: new users adopted stablecoins even faster than repeat ones (+8.5pp). Nearly every second new user now begins their Mercuryo journey with a digital dollar.
This suggests that users entering the platform increasingly favor assets with lower price volatility. In a falling market, stablecoins offer a way to access crypto rails while limiting immediate exposure to sharp portfolio swings.
Implications for builders
Stablecoins are increasingly being used beyond crypto trading, with holders turning to them for practical purposes such as moving money faster and at lower cost. For builders, this shifts what the first-touch product experience needs to solve: fewer questions about price exposure, more about settlement speed and competitive fees.
It also means stablecoin rails are moving to the center of the product. With demand still climbing, builders who invest in strong stablecoin infrastructure now are the ones positioned to capture it. Other assets remain part of the mix, but the depth of your stablecoin rails is increasingly what sets you apart.
Bitcoin, Ethereum and other tokens in H1 2026
With stablecoins covered, let's look at what happened across the rest of the board, primarily Bitcoin and Ethereum.
Ethereum still outsells Bitcoin on Mercuryo, but the lead is thinning fast. By volume share, the gap between them shrank from 3.4pp to under 1pp in six months. By transaction count it halved, from 5.9pp to 2.5pp.
The mechanics are one-sided: Bitcoin's shares barely moved while Ethereum's eroded. BTC demand looks structural, holding steady half over half; ETH demand tracked market direction more closely. Bitcoin behaved like the market's fixed point; Ethereum moved with the tide.
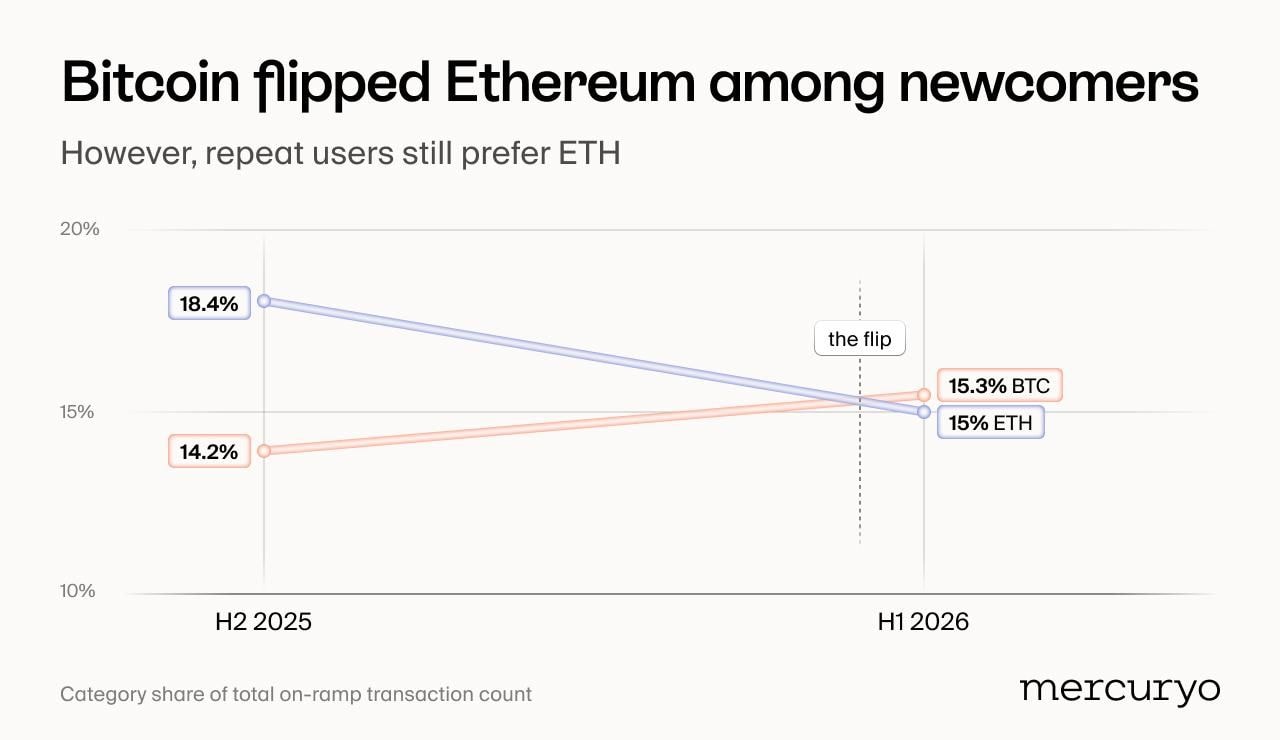
The front door tells its own story. Among newcomers, Bitcoin was the only major asset to gain first-buy share this half, up from 14.2% to 15.3% of first purchases. Ethereum slid from 18.4% to 15.0%, flipping their order.
In H2 2025, new users reached for Ethereum first; now Bitcoin edges it. Among repeat users, though, ETH still leads. The flip is an entry-point phenomenon, and it says something about where Bitcoin's brand does its heaviest lifting: it's still the asset people arrive for.
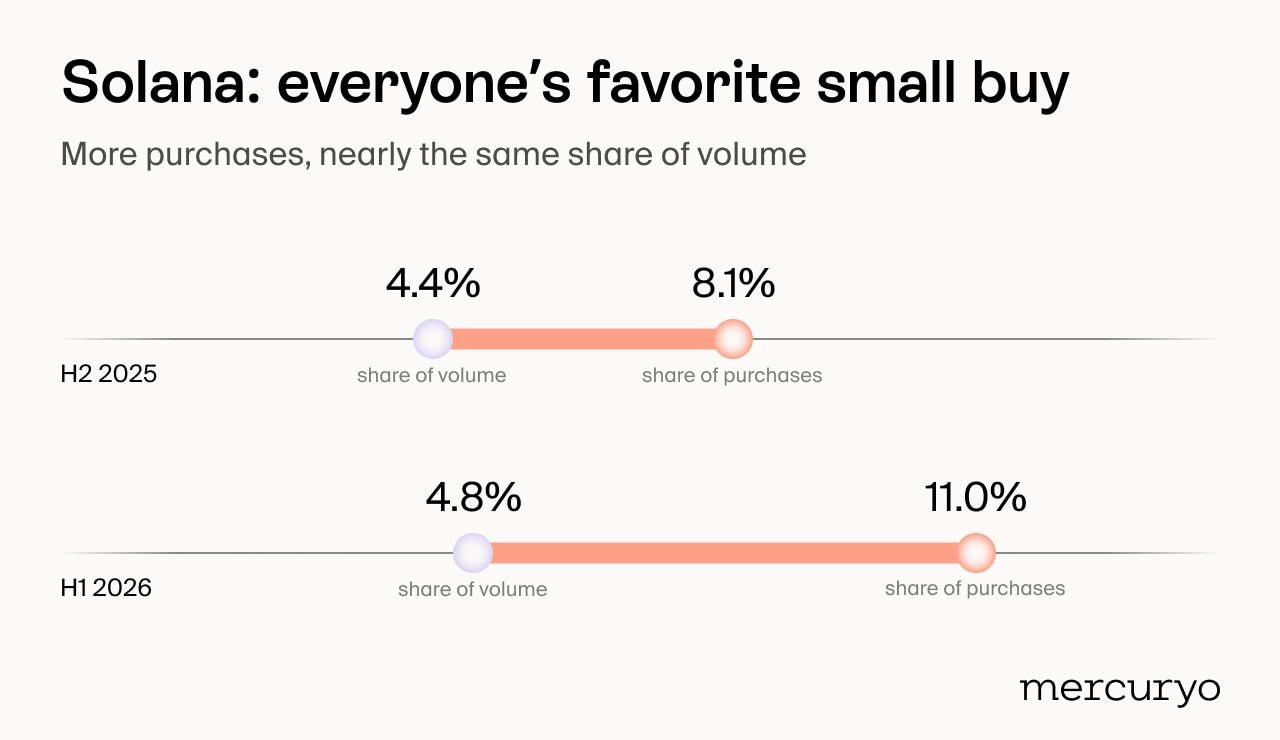
And then there's Solana, the coin with one of the most active crypto communities and the half's outlier. SOL was the fastest-growing major by purchase frequency, climbing from 8.1% to 11.0% of all buys and becoming the fourth most-bought asset on the platform.
However, its share of volume moved far more slowly, from 4.4% to 4.8%: people bought SOL often, but in small amounts. The average SOL order sat at roughly a third of the platform-wide average.
That activity also reflects Mercuryo’s broader role in the ecosystem. In April, we shared that Mercuryo had on-ramped more than $80M into Solana, while helping teams integrate faster and improve conversion. See the post →
Implications for builders
Don't treat the majors as a single bucket. Bitcoin serves users looking for a steady, structural holding, its demand barely registers market direction. Ethereum demand needs to be read against broader sentiment rather than treated as constant. Planning asset mix around "BTC/ETH" as one line item misses that they now move on different logic.
Solana adds a third profile: frequent, small purchases from an active community that values speed and low friction over ticket size. Its volume share understates its weight in the checkout flow, at one in nine purchases platform-wide, SOL generates disproportionately many transaction moments. Infrastructure built for quick, low-cost transactions matters as much here as support for high-value trades.
How people pay for their crypto
Payment choice is another lens on behavior. In H1 the two main options moved in opposite directions, and the split says more than either number alone.
By volume, the gap between cards and mobile wallets widened sharply. Cards grew from 55% to 66% of on-ramp volume, while mobile wallets fell from 37% to 29%.
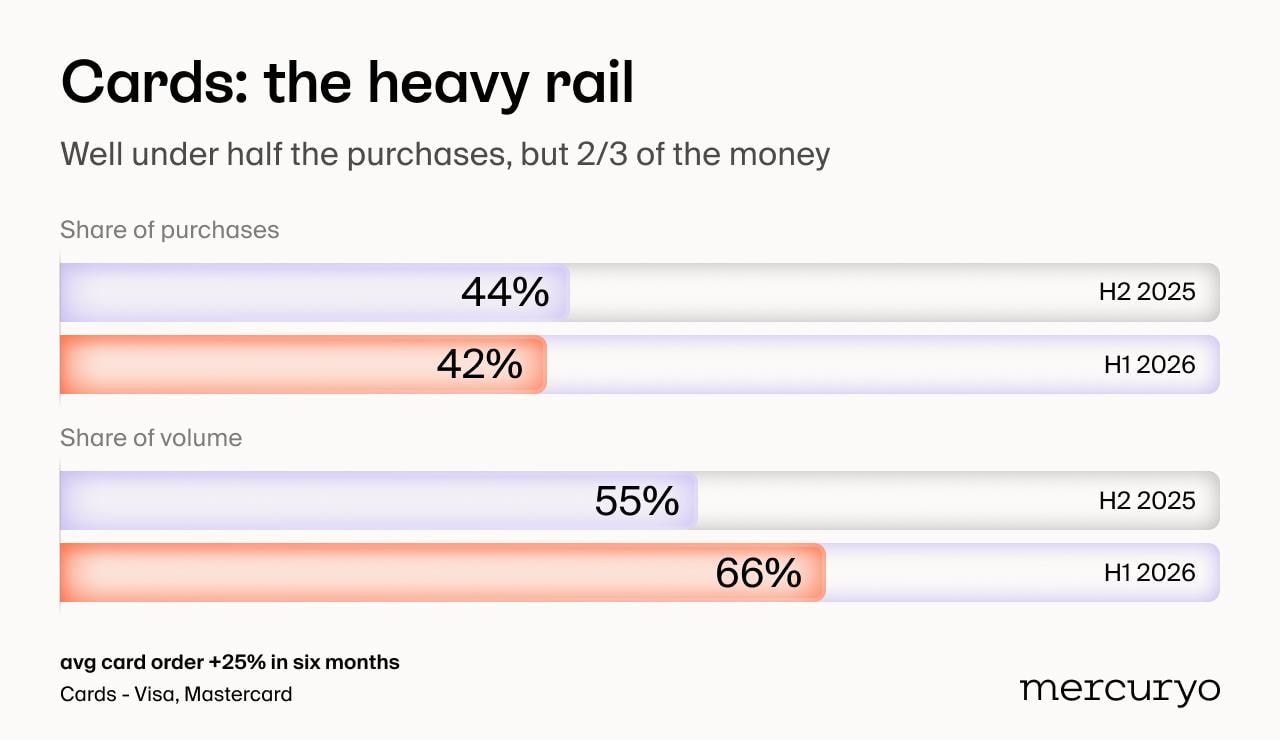
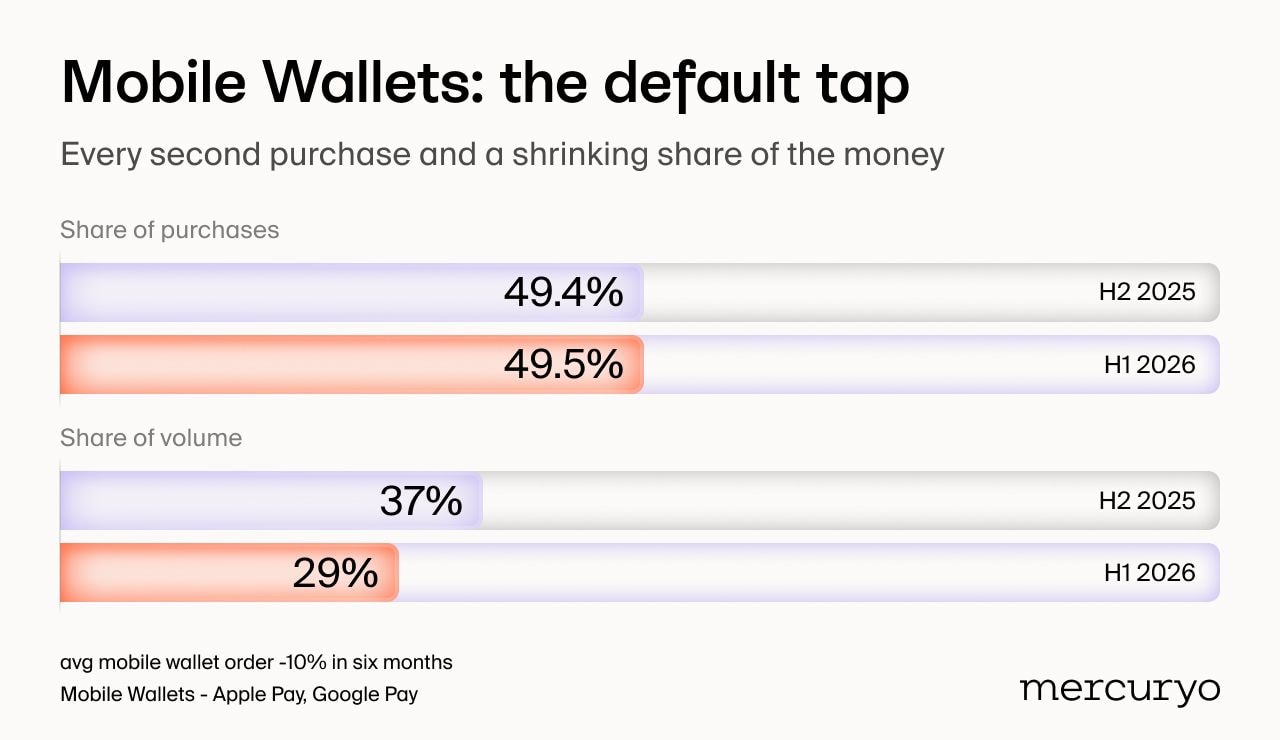
Interestingly, by transaction count, the picture inverts: mobile wallets held every second purchase on Mercuryo, exactly as they did six months ago, while cards slipped about 2pp to 42.4% of transactions.
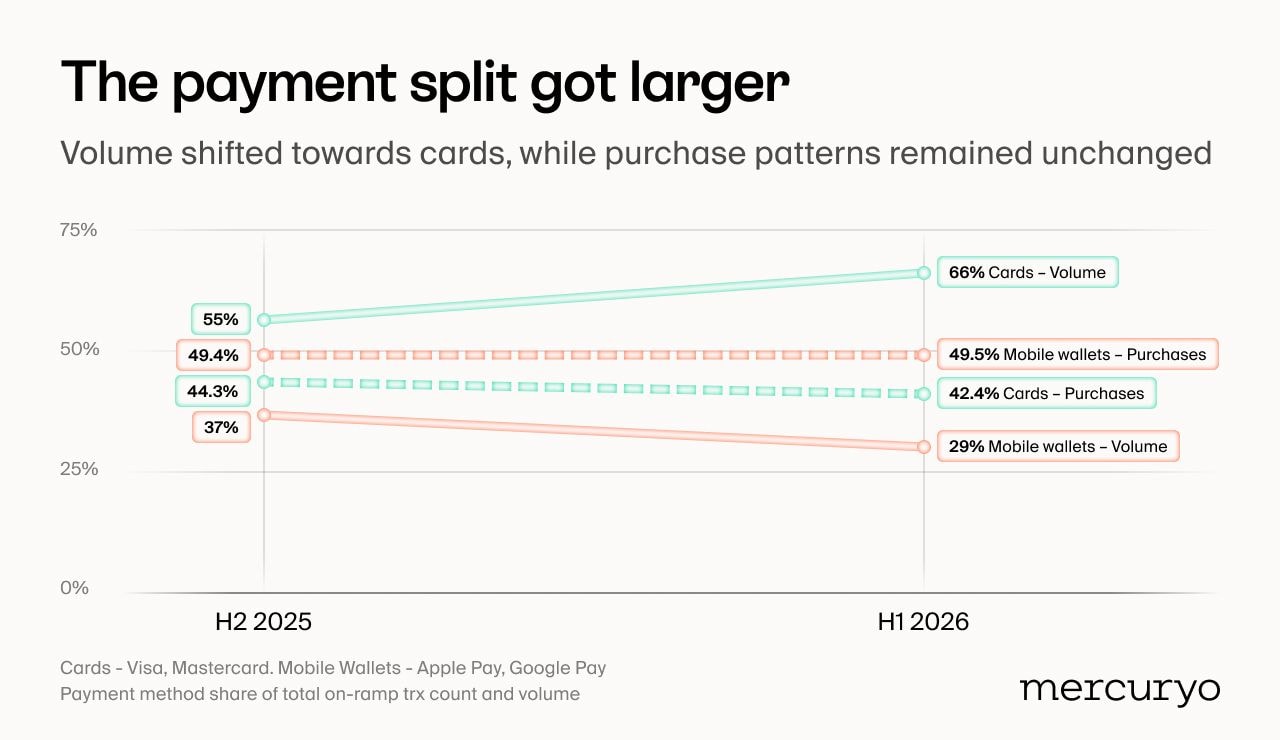
Although cards are used slightly less often, the data shows people tend to make larger purchases with them. The average order paid by card grew 25% half-over-half, the main factor behind growing card volumes despite the dip in transaction share.
Mobile wallets went the other way. They still account for every second purchase, but their volume share dropped, and the reason is again average order size: mobile wallets orders shrank about 10% half-over-half.
Users are increasingly reaching for mobile wallets for smaller purchases rather than large ones. The two rails are no longer competing for the same job: one is where the habit lives, the other is where the money does.
Implications for builders
The split comes down to what each rail is for. Cards are cementing as the tool for bigger, more considered purchases; mobile wallets are settling into quick, more routine spending. Product flows should reflect that. Card checkout can afford a little more friction if it buys better fraud protection or higher limits, while mobile pay needs to stay fast and frictionless above all else.
That makes payment support a two-use-case decision, not a one-size-fits-all one. Optimise only for transaction count and you underserve the card users driving most of the volume. Optimise only for volume and you lose the frequent, smaller wallet purchases that keep users coming back. Builders who treat these as two distinct flows will capture more of both.
Mobile vs desktop and iOS vs Android spending
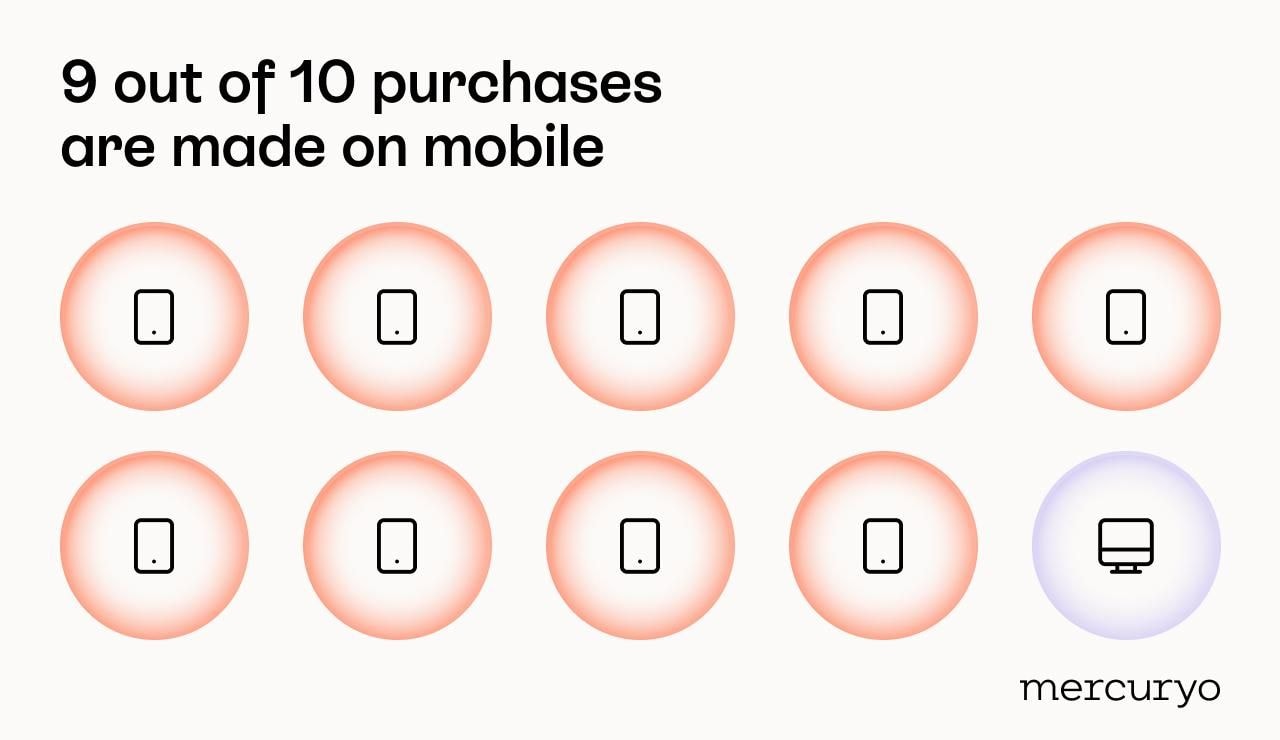
Nine in ten crypto purchases on Mercuryo came from mobile devices in H1, unchanged from H2 2025. The headline number is settled; the movement is underneath it.
iOS vs Android spending
iOS users are often treated as the more valuable mobile audience, and app-economy data gives that assumption some weight. RevenueCat found that subscription apps generated around five times more realized lifetime value from iOS users than from Android users globally.
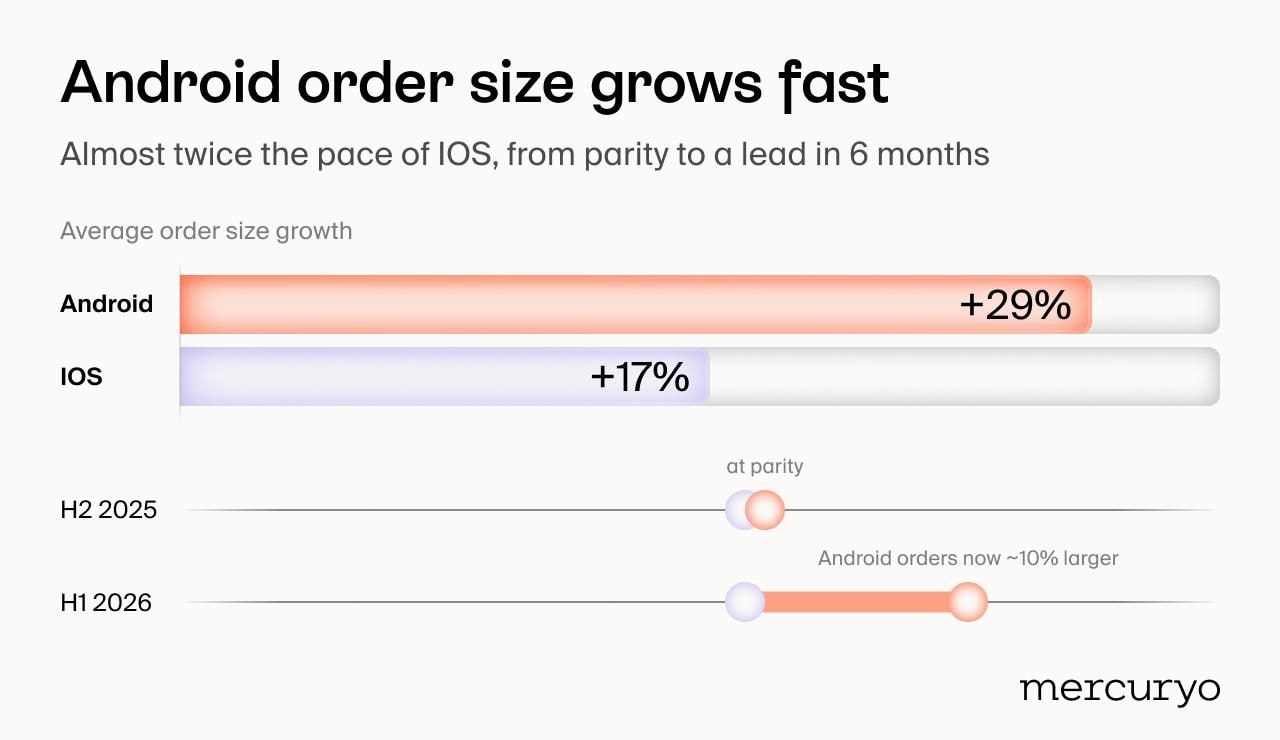
Mercuryo’s data tells a different story. Android users’ average order size grew 29% half-over-half, compared with 17% for iOS. Six months earlier, the two were practically equal. By H1 2026, Android had moved into a roughly 10% lead.
The broader platform split barely changed. iOS still accounted for 54% of transactions and 51% of volume, while Android represented just under 40% of both. But when it comes to purchase size, the direction is clearly Android’s: the premium-iOS-spender assumption did not hold on Mercuryo this half.
The second familiar assumption is that users spend more per purchase on desktop than on mobile. Wider ecommerce data generally supports it. Dynamic Yield reports an average order value of $255 on desktop versus $164 on mobile, while Contentsquare found desktop conversion rates were 74% higher despite mobile driving most traffic.
The usual explanation is straightforward. Larger screens make it easier to compare options, review information and complete more complex checkout flows, while mobile is associated with quicker, lower-commitment purchases.
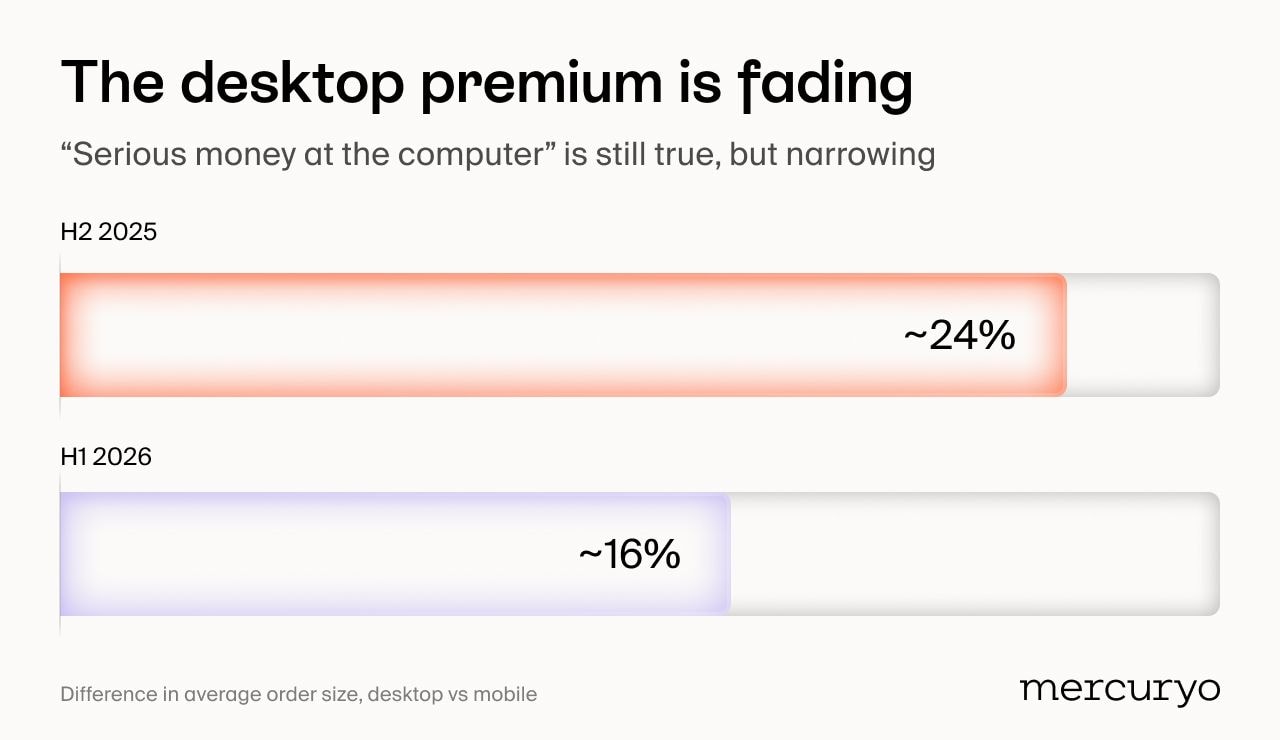
Mercuryo’s data broadly follows that pattern, but the gap is closing quickly. Desktop still carried the larger average order in H1 2026, so the desktop premium remains visible. However, it narrowed from 24% in H2 2025 to 16% in H1 2026 as mobile order sizes grew faster: up 22%, compared with 14% on desktop.
That shift suggests mobile is no longer confined to quick, low-value purchases. Users are increasingly comfortable making larger transactions on their phones, even if desktop still leads overall.
Implications for builders
The premium-iOS-spender assumption doesn't hold on Mercuryo. Build around it and you under-invest in Android, which is exactly where order sizes are growing fastest right now. It deserves at least as much product attention as iOS, not less.
The narrowing desktop gap points the same way. Mobile is closing on desktop in order size, so checkout flows built around "mobile for small buys, desktop for big ones" are aging out. The teams improving mobile UX for large, considered purchases, not just quick small ones, are building for where things are going.
Key takeaways: crypto buying trends in H1 2026
Put together, H1 2026 was the half crypto buying consolidated: money into stablecoins, frequency onto phones and mobile wallets, purchase size onto cards. Several common assumptions didn't survive contact with the data: stablecoins became the default first purchase rather than a later step, Android users started out-spending iOS users per order, and mobile order sizes closed in on desktop's.
For anyone building around payments or Web3, the through-line is practical: you need deep stablecoin rails, payment flows that fit both fast everyday spending and larger deliberate purchases, and mobile checkouts that handle high-value orders as smoothly as low-value ones.
Three things we're watching in H2: whether Solana's purchase growth holds once the rotation matures, whether the card-wallet order-size gap keeps widening, and whether stablecoins cross half of all first purchases. We'll report back either way.
This is the first edition of the Mercuryo on-ramping report, and we'll publish the next when H2's numbers are in. Follow us on LinkedIn or X to catch it. And if you're building around payments or Web3 and want to dig into any of these metrics for your own use case, reach out: we're happy to talk it through.
Methodology
This report compares H1 2026 (January 1 – June 30) with H2 2025 (July 1 – December 31), based on Mercuryo's on-ramp product only, and covers accepted transactions.
Stablecoins are defined as USDT and USDC combined. Payment methods are grouped into cards (Visa, Mastercard) and mobile wallets (Apple Pay, Google Pay). Device and OS breakdowns (mobile vs desktop, iOS vs Android) use the identified platform at time of purchase; transactions with unidentified platform data are excluded from device-specific metrics.
New users are those making their first transaction through Mercuryo; repeat users are those transacting beyond their first.
"Share of purchases" means share of transaction count; "share of volume" means share of value processed; "average order size" is the ratio of the two.
Percentage-point (pp) changes refer to shifts in a share; percentage (%) changes refer to relative growth or decline in the underlying figure.
All figures are shares, ratios and growth rates; absolute transaction counts and value are not disclosed.
Disclaimer: This content is for informational purposes only and does not constitute investment advice. Crypto assets carry risk.